The project
Zero Wait stands for better pedestrian crossings, zero pedestrian deaths and net-zero carbon emissions. It's run by the Active Mobility Forum with Young Urbanists and the Bicycle Mayor of Cape Town, towards a goal of half of all trips made on foot or by bike by 2030.
The campaign needed evidence, not just a message: people had to be able to see how dangerous the crossings on their own street are — and add their voice. The site does both in one page: take the survey, then explore the data.
What we did
01Refined the campaign design
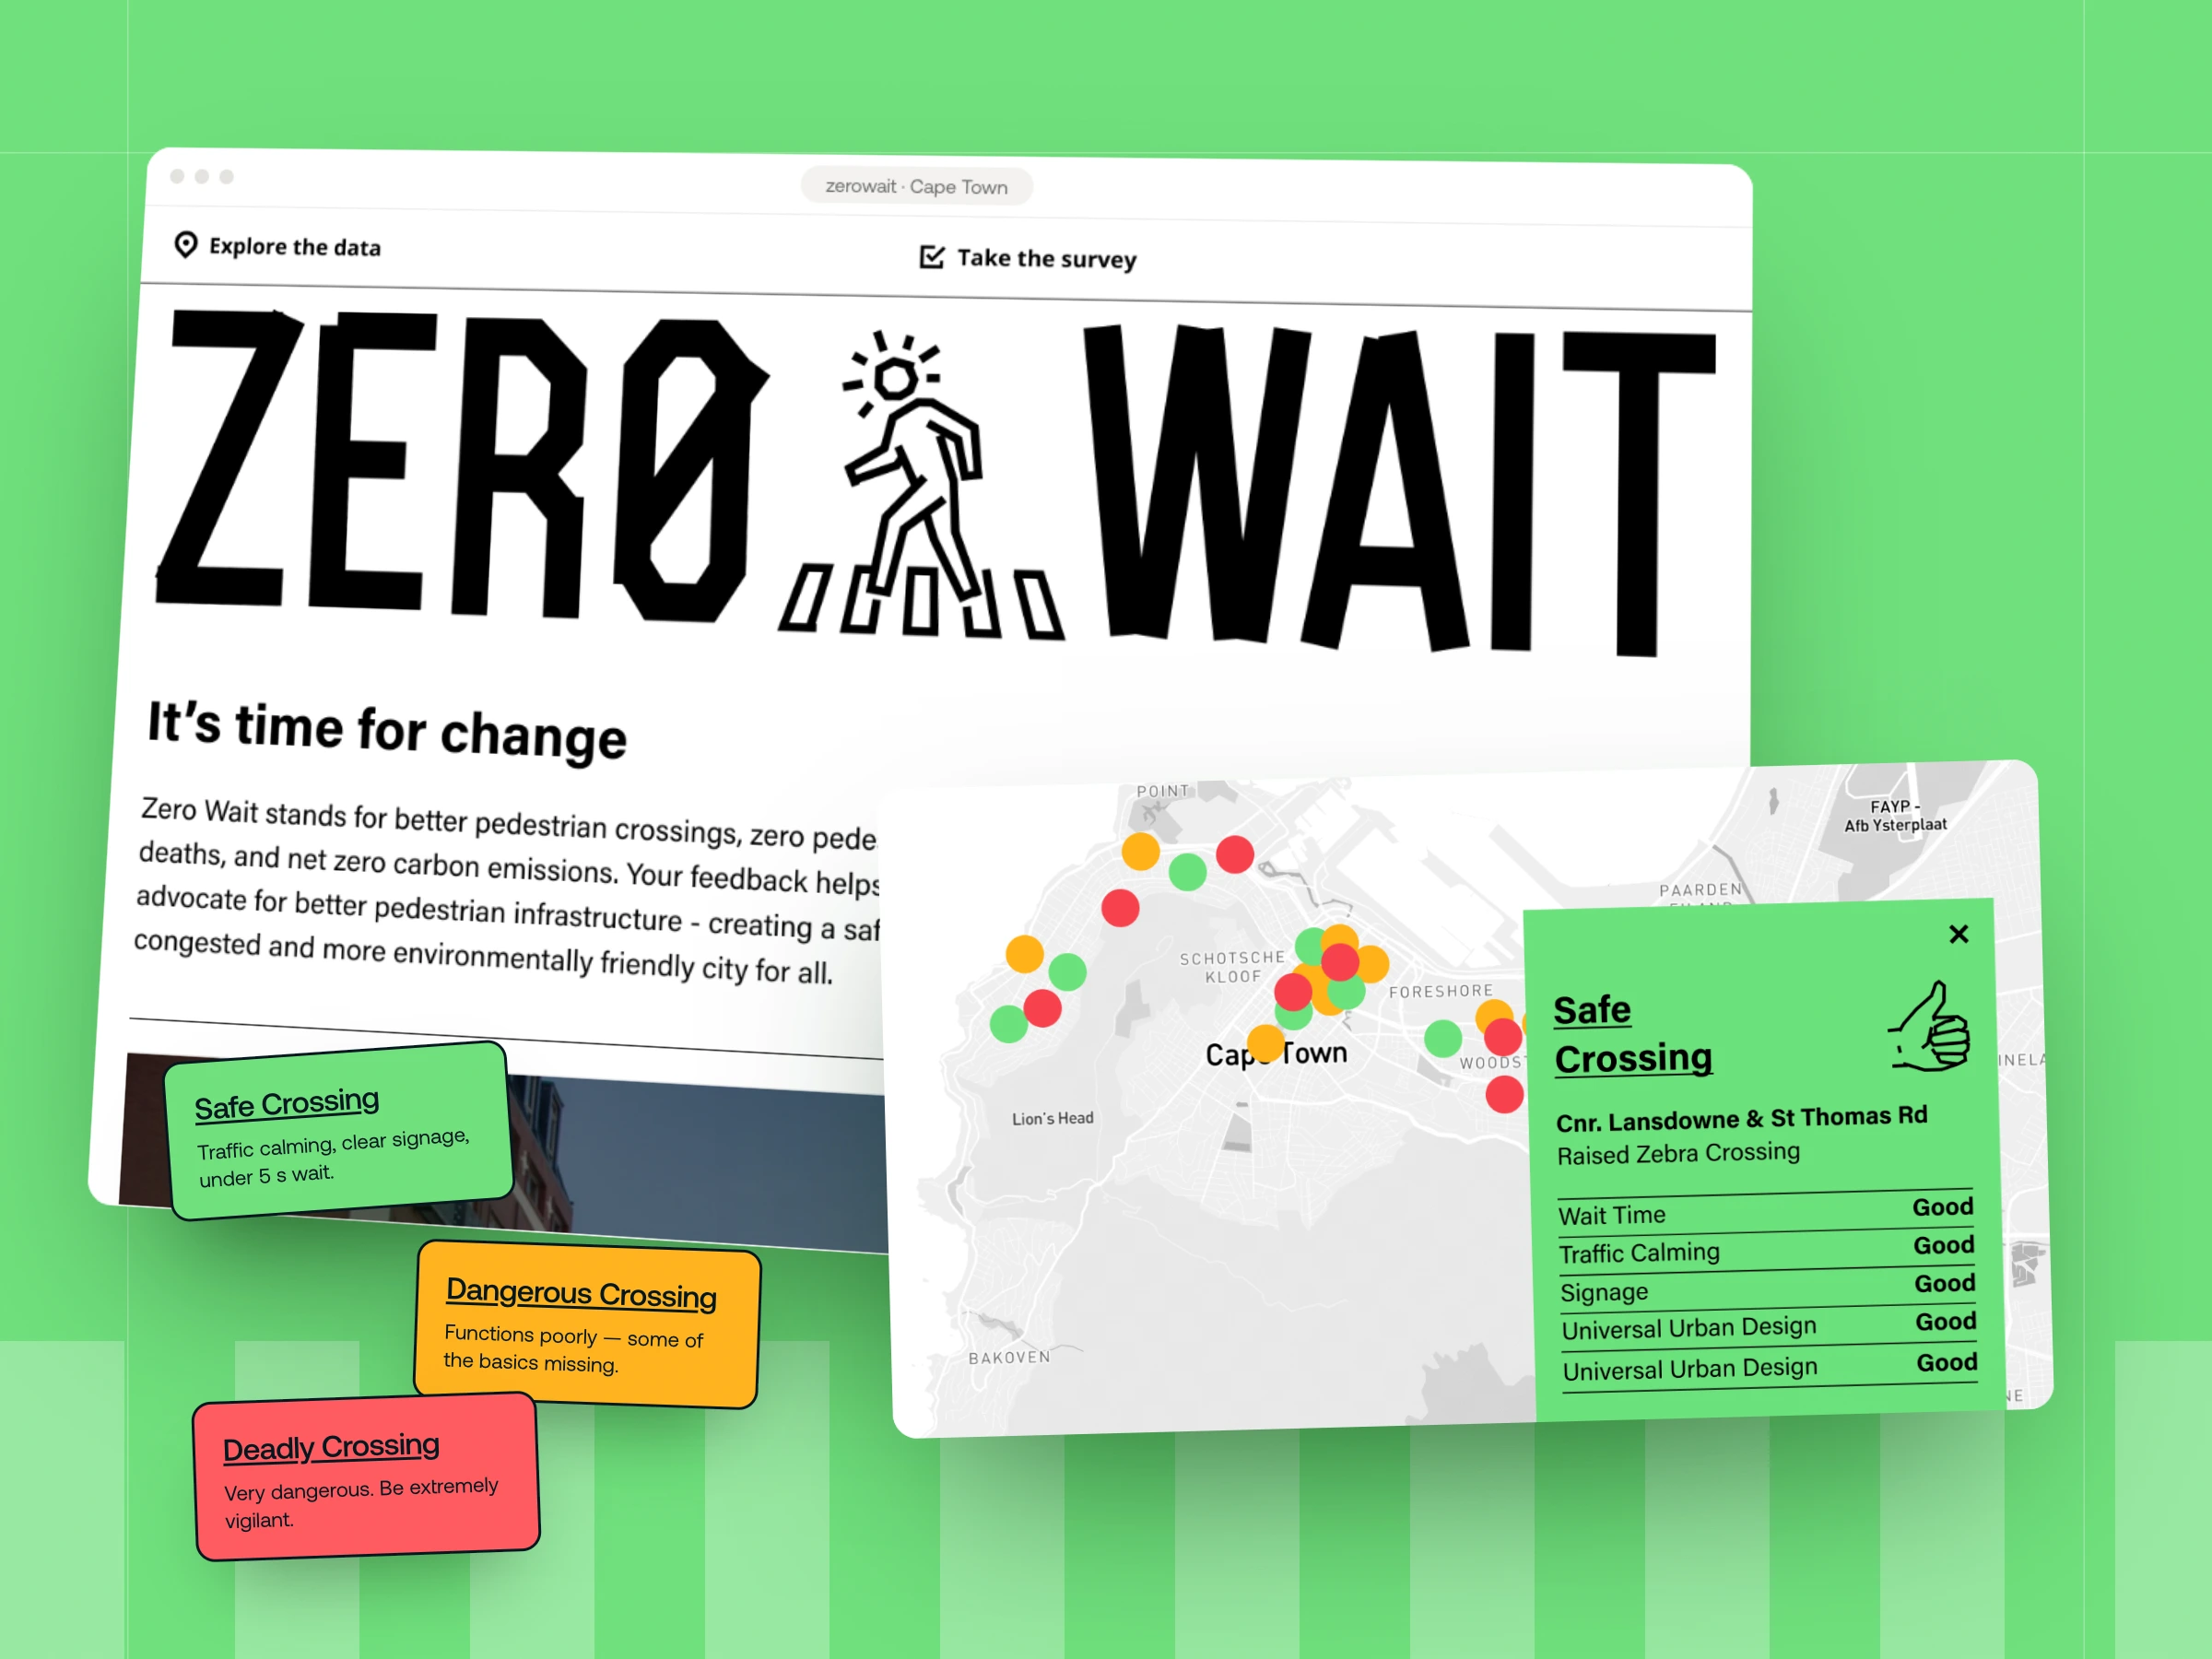
We kept Zero Wait's bold black-and-white identity and zebra-crossing mark, and tightened the layout so the two actions — take the survey, explore the data — lead every screen.
02Built the crossing map
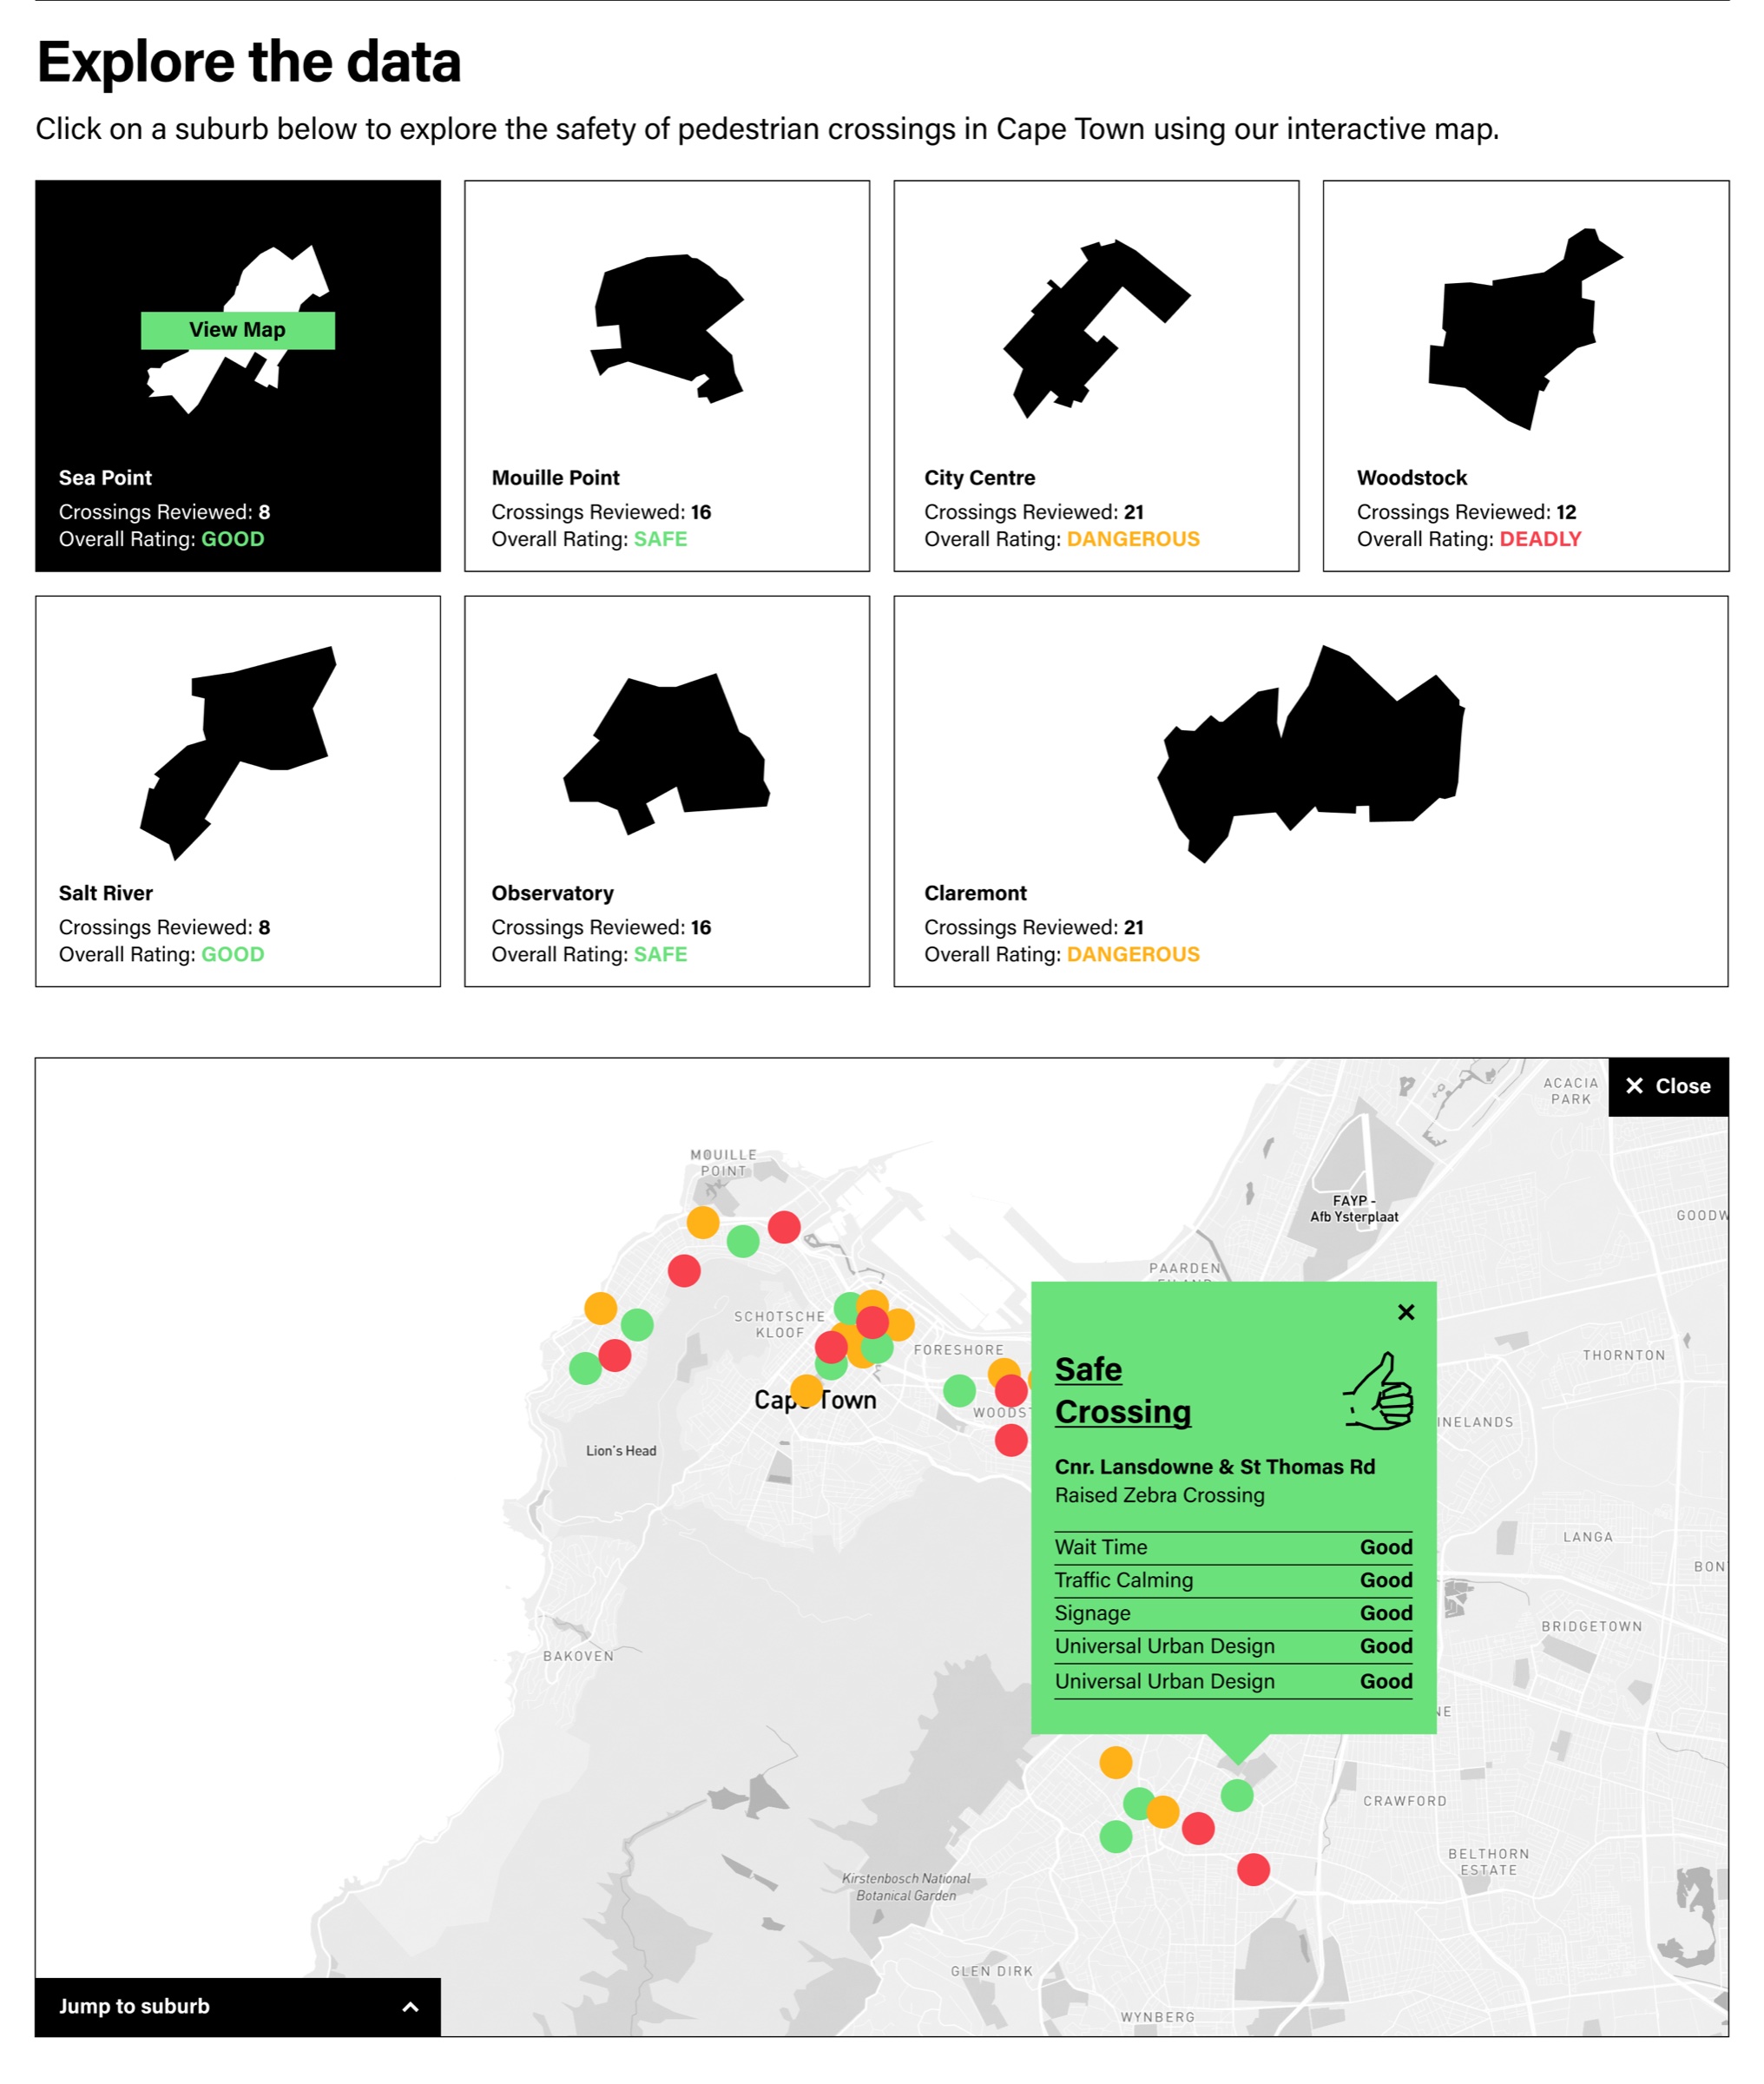
Suburbs open onto a map of their crossings, each pinned as safe, dangerous or deadly. Clicking a pin shows the crossing, its type and how it scores on wait time, traffic calming, signage and universal design.
03Turned visitors into data
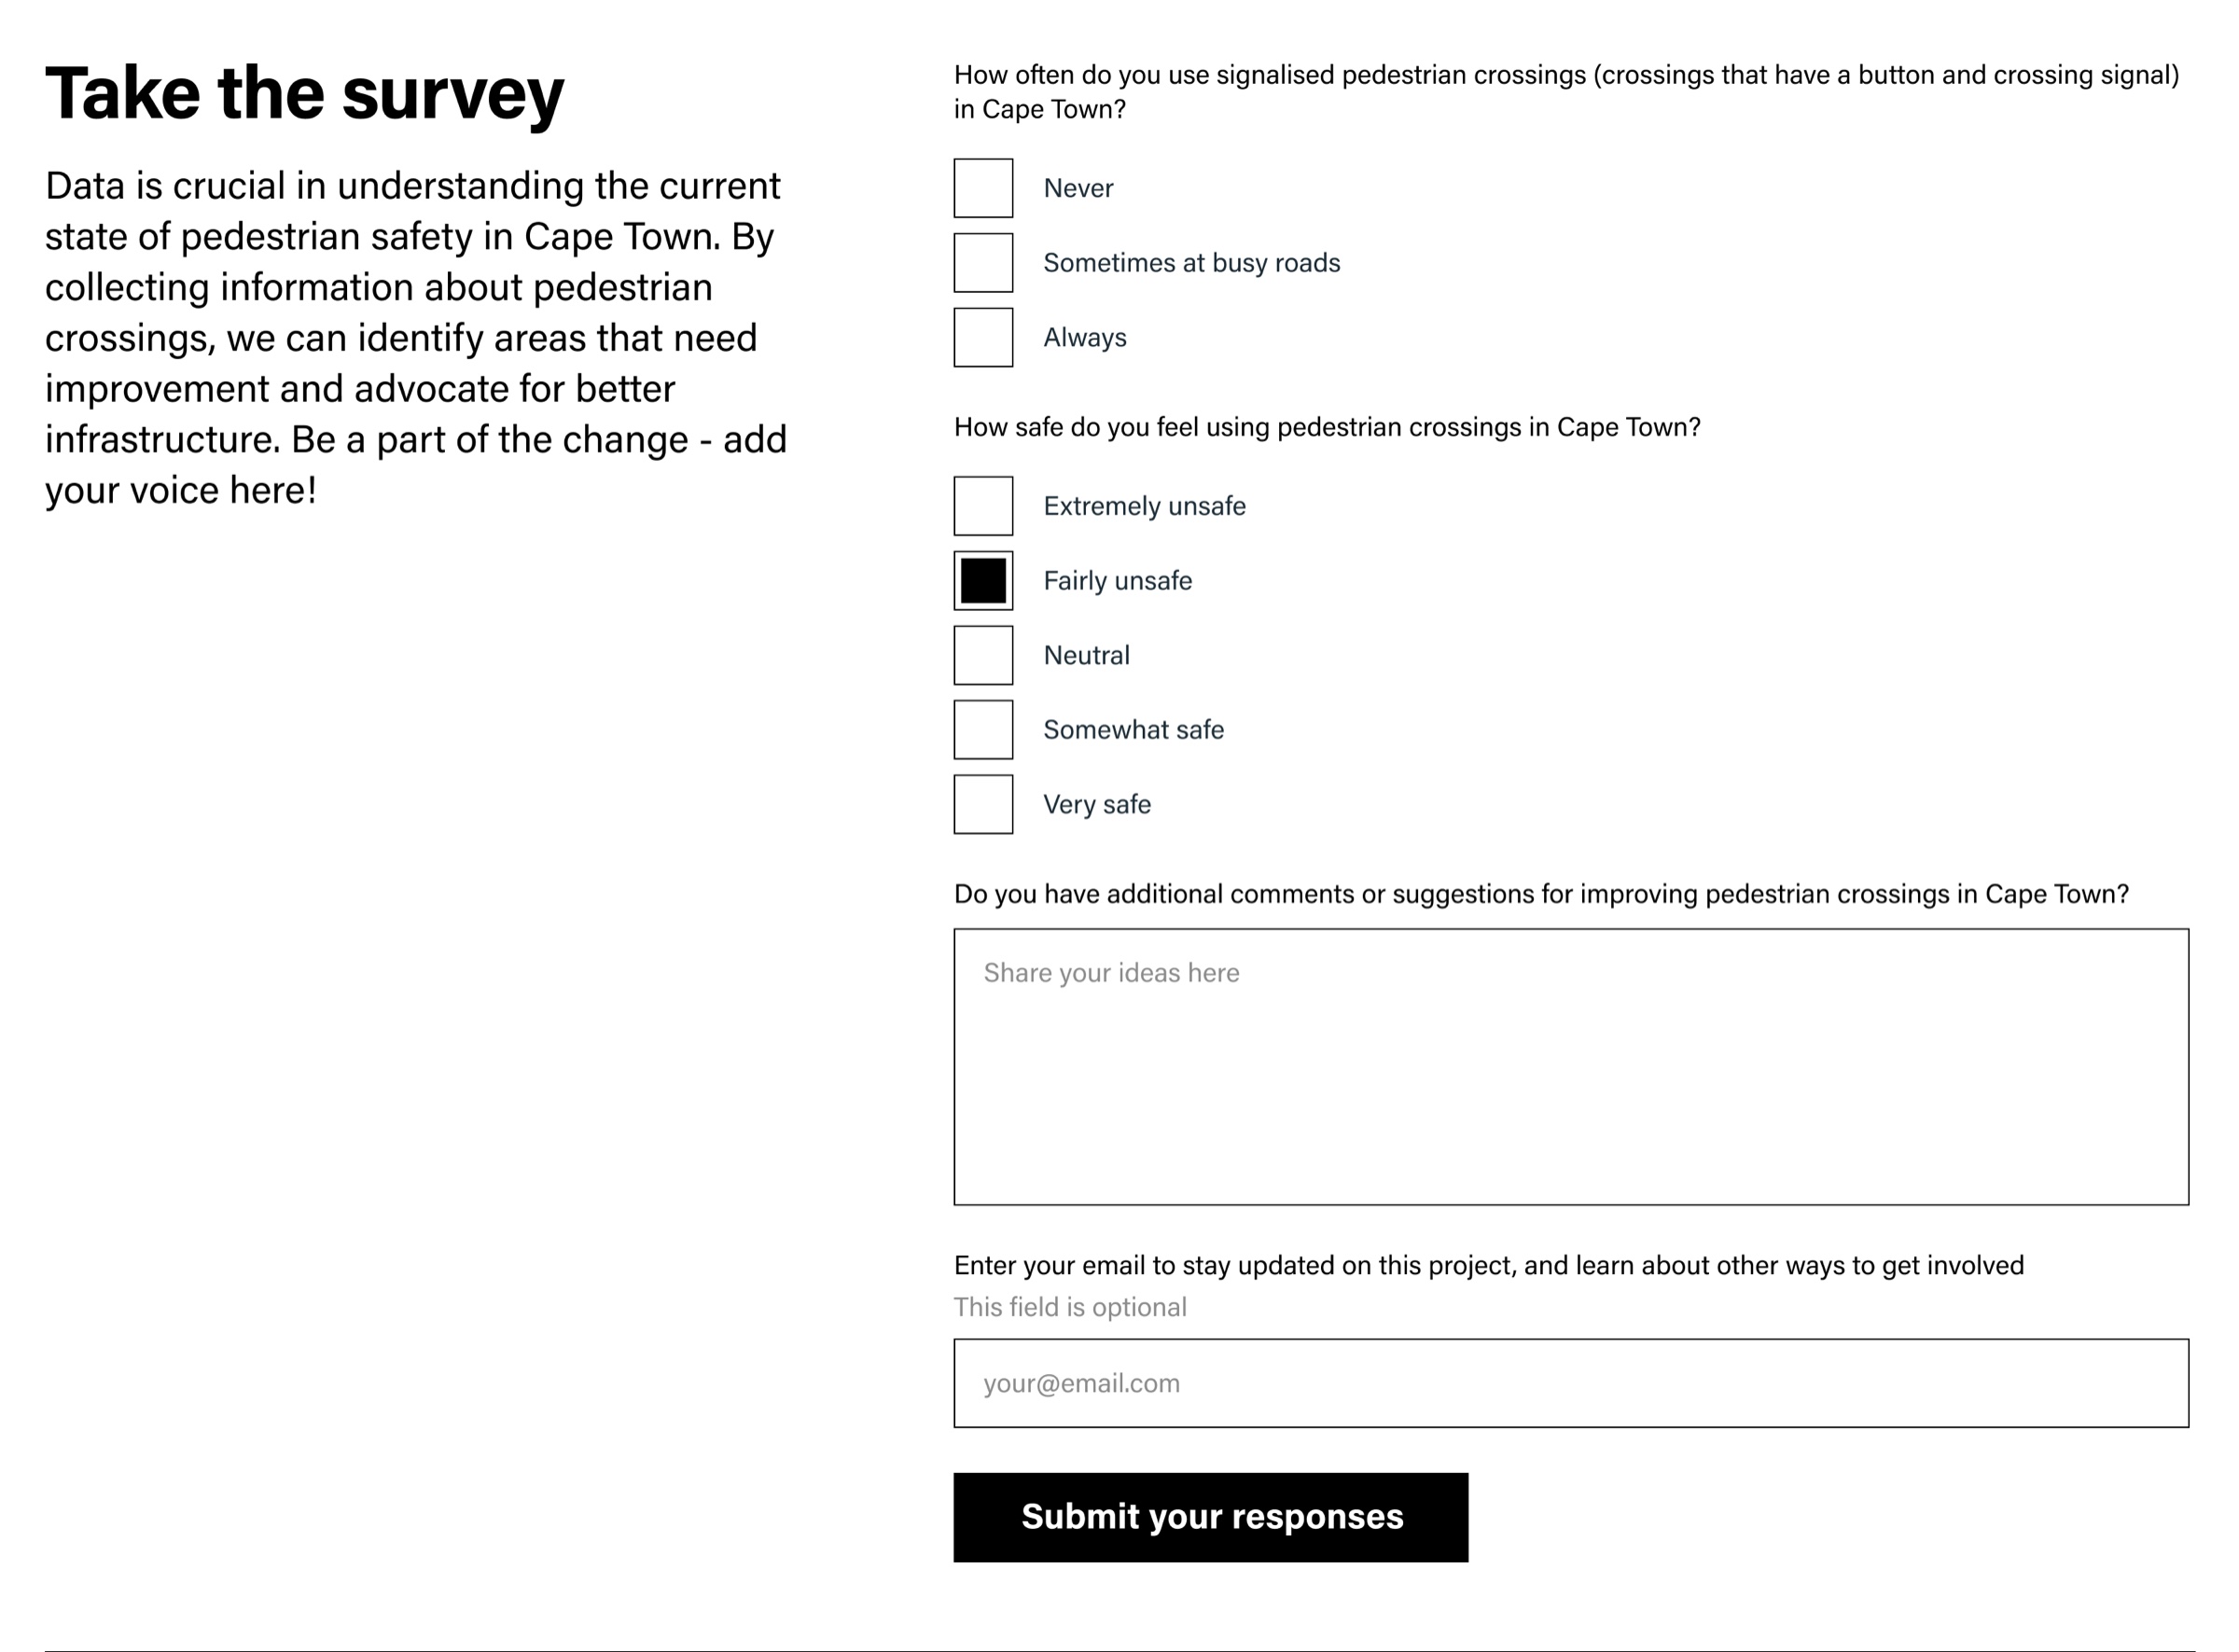
A short survey on how often people use signalised crossings and how safe they feel feeds the campaign's advocacy, alongside a newsletter sign-up and one-tap sharing.
- Cape Town suburbs on the map
- 7
- Crossing ratings: safe, dangerous, deadly
- 3
- Criteria behind every rating
- 5
- Page: survey, film, map and sharing
- 1
What the ratings mean
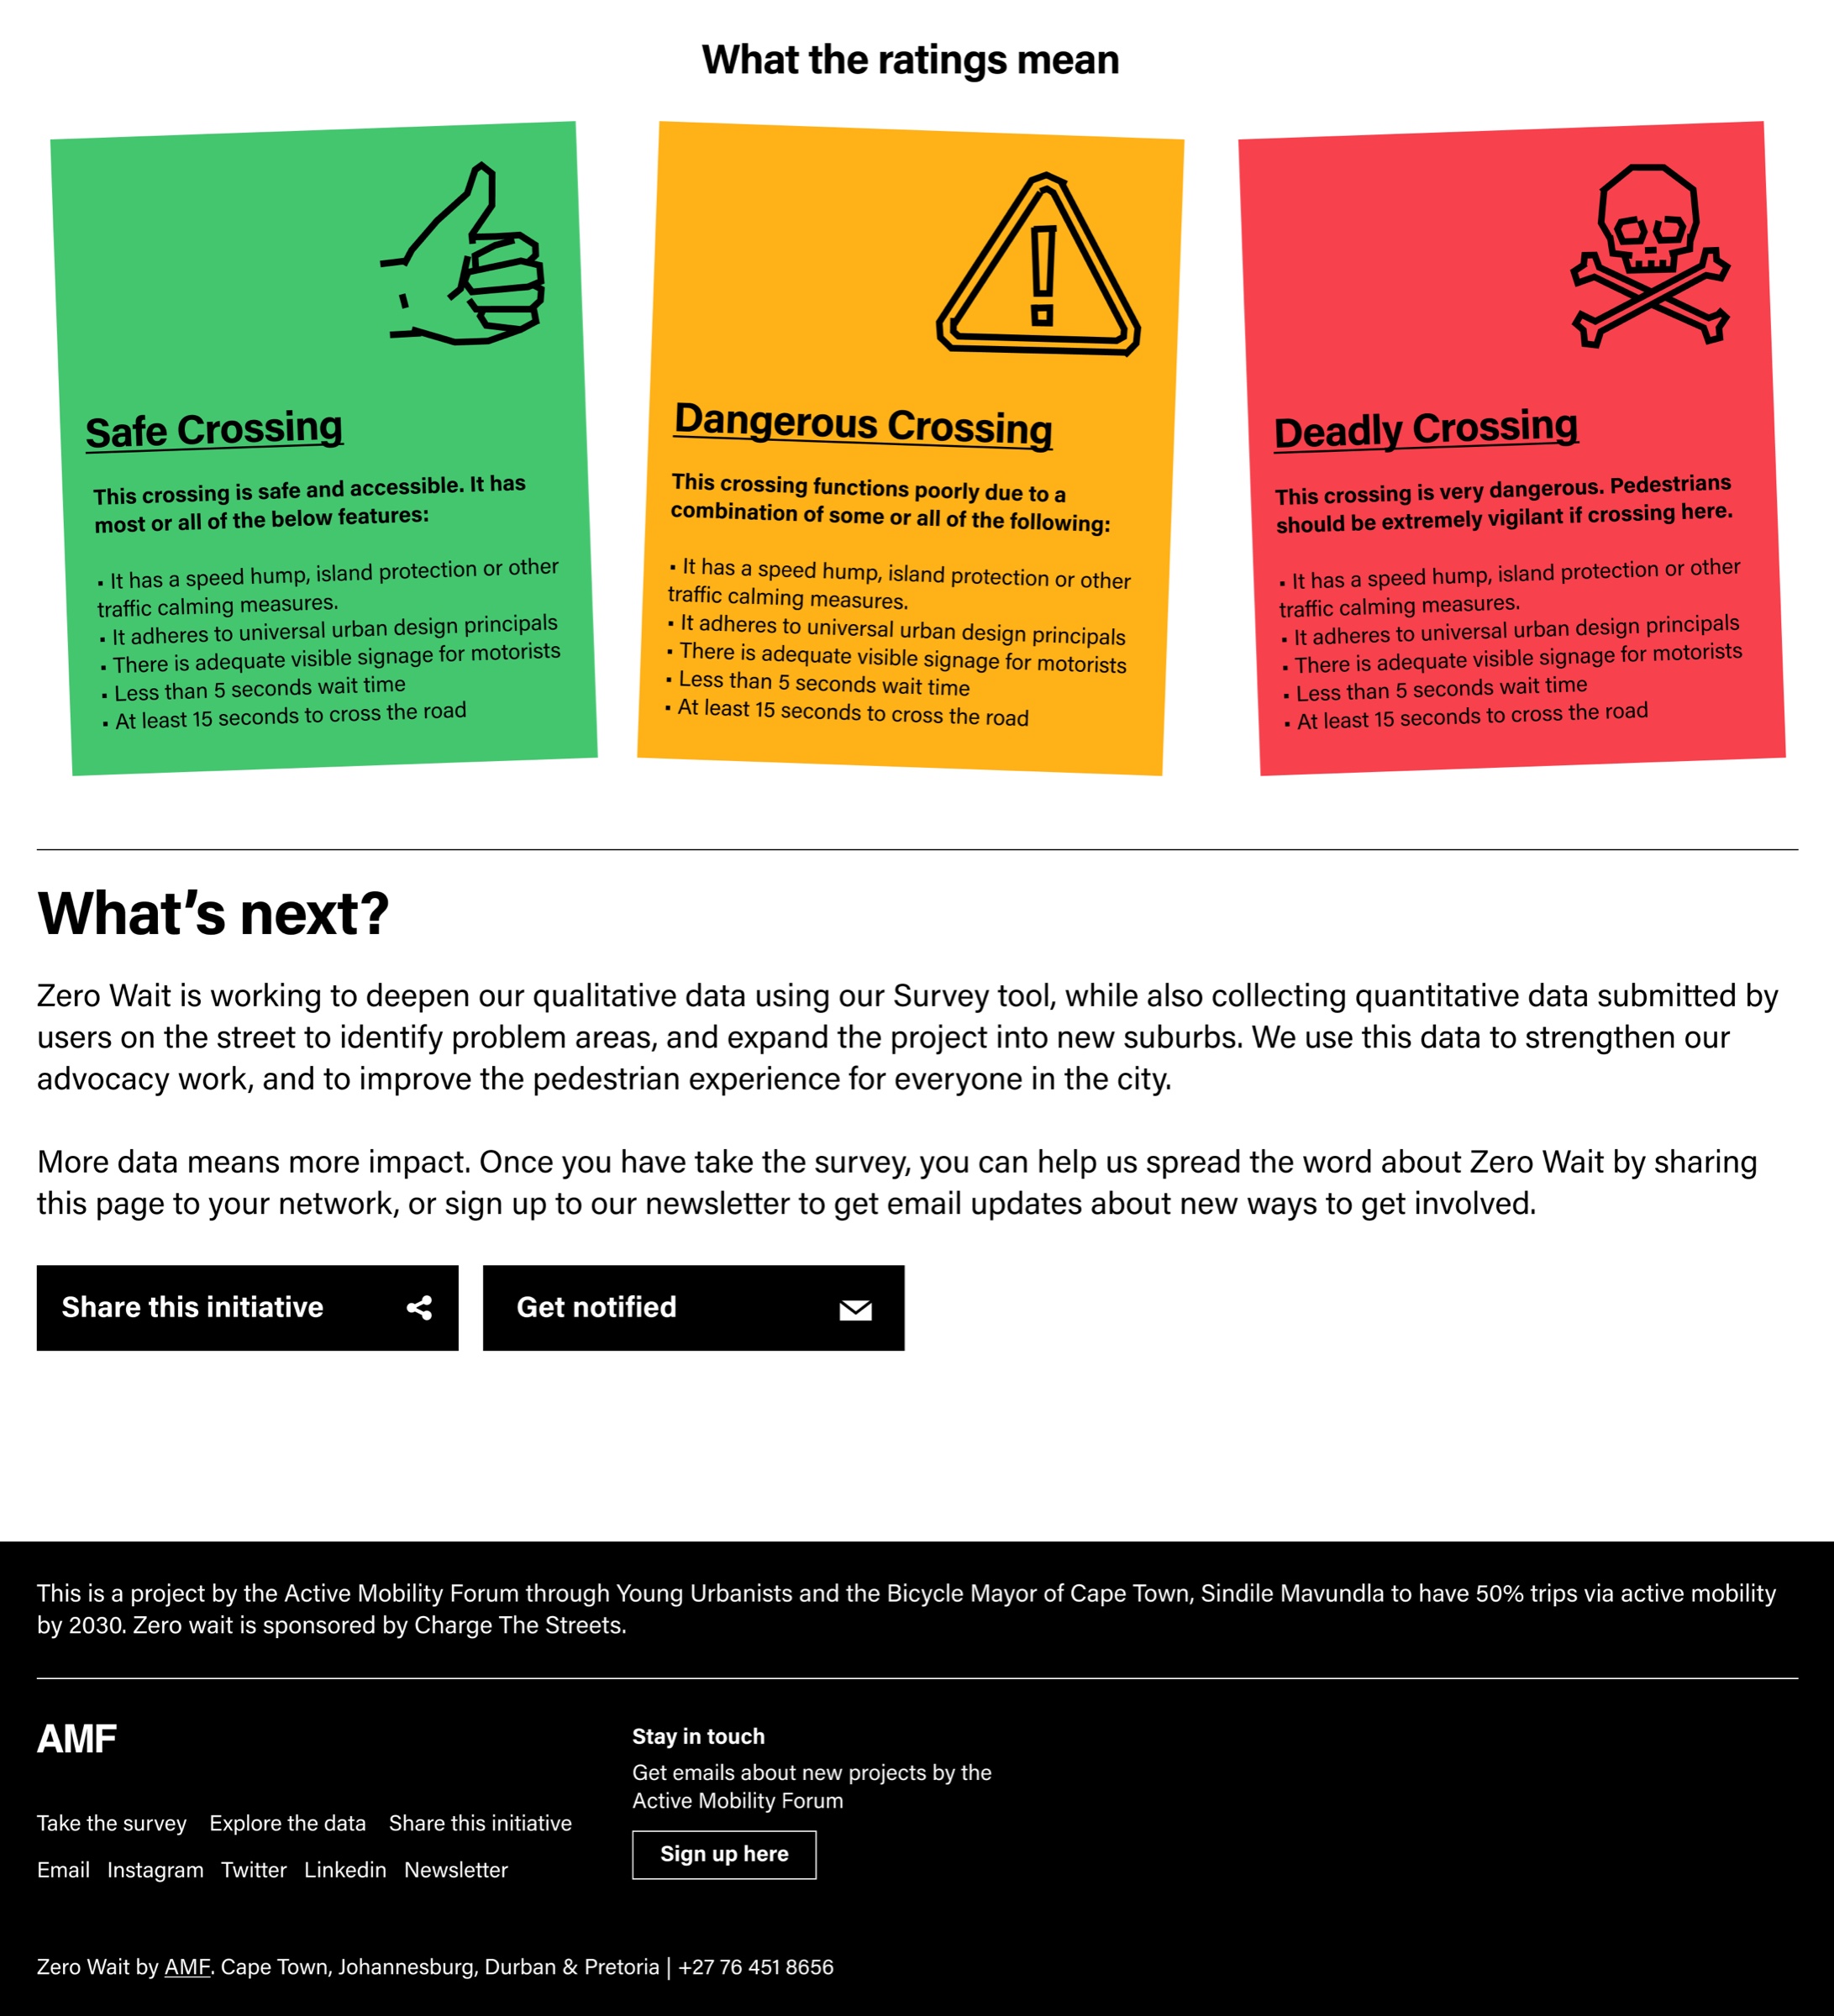
Every crossing is scored on the same five criteria. The map shows the verdict as a colour; the popup shows the reasons.
| Rating | What it means |
|---|---|
| Safe crossing | Safe and accessible — meets most or all of the criteria below. |
| Dangerous crossing | Functions poorly because some of the criteria are missing. |
| Deadly crossing | Very dangerous — pedestrians should be extremely vigilant. |
| The five criteria | Traffic calming (speed hump, island) · universal urban design · signage visible to drivers · under 5 s wait · at least 15 s to cross |